Thursday, October 15, 2009

Pitching Around Manny

You could walk Manny here, but the last thing you want to do is put the winning run on base....

As I watched last night's game, with the Phillies repeatedly facing Manny Ramirez in the worst possible positions, I had to wonder - why aren't they pitching to him the way the Yankees pitched to Joe Mauer? That is - basically avoid him. Be happy with walking him. And the answer repeatedly was:
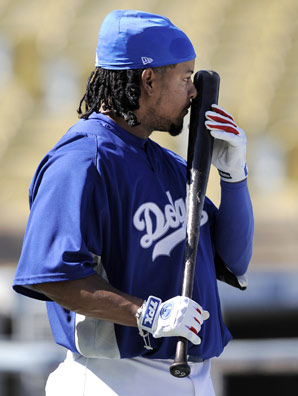
the last thing you want to do is put the winning run on base....

I hear that. Matt Kemp is no slouch. But I wondered, perhaps inanely, just what was the best plan from a purely mathematical standpoint. At what point, when holding a one-run lead, does adding another baserunner change the "expected runs" for an inning from under one run to over one run?

And since I hadn't published anything yesterday, and didn't have any better ideas, I thought I'd punish you folks with the results.

So here's what we're gonna do. We're gonna start with Palmer and Thorn's Run Expectancy Matrix. (Easy does it. It's math, but don't freak out. I'll explain it, I promise. Just stick with me through the next paragraph.) Then we'll see at what point adding a runner increases the expected runs from less than one to more than one. And we'll see if it jives with the common knowledge that you don't want to put the winning run on base.

So first, what is Palmer and Thorn's Run Expectancy Matrix? It's simple. It's a neat grid that shows, given a certain number of outs and people on base, the average number of runs that should score that inning, based on 75 years of major league games. It was published in The Hidden Game of Baseball by Pete Palmer and John Thorn. It looks like this:

OUTSNone1st2nd3rd1st & 2nd1st & 3rd2nd & 3rdFull
0 Outs0.4540.7831.0681.2771.381.6391.9462.254
1 Out0.2490.4780.6990.8970.8881.0881.3711.546
2 Outs0.0950.2090.3480.3820.4570.4940.6610.798


How does it work? Let's do an example. See that number 1.068 in the first row? That means that in innings that had a runner on 2nd base (the column) and zero outs (the row) the team (over 70 years of studying baseball) averaged scoring 1.068 runs that inning.

Now, it's important to understand that this matrx doesn't know who is pitching or who is batting next. It's essentially nothing more than a baseline. But if you understand that, you can use this little chart for all kinds of stuff. And I want to know at what point walking a player puts the expected runs over the value of 1. Here's what is say:

With 0 outs - You don't want to walk a batter when you only have a guy on first base. Doing so increases the expected runs from .783 to 1.38. In any other situation, you're already expecting to give up over one run. So you're OK, provide you don't force an existing runner to the next base. That seems to follow common baseball wisdom.

With 1 out - You don't want to walk a runner if there is someone on third base. (But it's OK if there is a runner on 1st or 2nd base, strangely enough.) You also don't want to walk a runner to load the bases if there are only runners on first and second. This is NOT baseball wisdom, and points out how silly this exercise might be, in my opinion.

With 2 out
- You walk the batter and you don't much care what else the situation is, provided you don't walk in a run. The expected runs never get over one run, unless you're silly enough to walk a run in and have exactly the same situation with the next batter.

So the lesson is that the prevailing wisdom isn't totally correct.
- If there are no outs, walk the guy provided you're not moving another into scoring position.
- If there is one out, don't walk a guy to put runners on the corners. That seems totally counter-intuitive, since it also sets up the double-play. But there it is.
- If there are two outs, walk the guy. Tempting fate isn't a bad option. Especially if the next batter is Jason Kubel.

(I keeeeed. I keeeeeed, Jason. I make funny.)

Have a good weekend folks. See you Monday.

Tuesday, October 13, 2009

There's a Stat for That: Adjusted Runs Prevented

It's hard to argue for or against relievers based on statistics. Relievers can give up other pitcher's runs without their own ERA taking a hit. Hits, walks and strikeouts don't necessarily depict how successful a player was. And of course saves are borderline silly.

What would really be valuable would be a stat that somehow gave credit for stranding inherited runners, but cost a reliever when he got the team into a jam.

Turns out, there's a stat for that. It's called Adjusted Runs Prevented, or ARP.

I've become hesitant to introduce any new stats, because this is when the vast majority of eyes glaze over. I'm going to try it anyway with ARP, because it's just so darn simple. It's also ultimately very, very powerful when talking about relievers. But first, the simple:

ARP = expected runs when a reliever enters a game - expected runs when he left the game.

So say a reliever comes in with runners on the corners and no outs. From studying tens of thousands of previous MLB innings, we know, on average, how many runs will score that inning. It's about 1.9. So if the reliever strands those runners, he gets +1.9 ARP. If he gets out of the inning with just one run scoring, he gets +.9. If two runs score, he gave up more runs then the average, so his ARP is -.1.

Or say a reliever comes in to pitch the ninth inning. The average runs scored in an inning are .56. So if he pitches a perfect ninth, he gets +.56 ARP. And if he gives up a 2-run home run to Alex Rodriguez (for example) his ARP would be -1.44.

If you have some more questions about ARP, leave them in the comments section. We can do some more complicated examples there if you like.

Anyway, ARP is exactly what it is named; it is how many runs a reliever prevented. And those runs aren't random - they're the average runs from decades of major league games. Finally, there is no goofy extra credit for pitching late innings - really valuable middle relievers or setup men often lead the league in ARP. It is an EXCELLENT statistic for showing which relievers have had the best year. It's a MVP stat for relievers.

So who were the top relievers this year? Of the 729 relievers tracked by Baseball Prospectus, here's the top five:
Andrew Bailey (OAK) +29
Michael Wurtz (OAK) +28.3

Joe Nathan (MIN) +28

Matt Guerrier (MIN) +26.8

Mariano Rivera (NYY) +25.8


That third name might surprise some Twins fans. Turns out Joe Nathan had a hell of a year. Remember, he lost ARP runs in those games where he collapsed, but overall he was extremely effective. You can't find three guys in the majors that were more effective than him.

What's more, this was not a one-year thing. Nathan ranked #7 in overall ARP last year. By the way, there was only one other guy who was in the top 10 both years. It's Mariano Rivera.

But it's also not just a two-year thing. Because in 2007 Nathan was #8. Rivera finished 21st that year. And it keeps going...
In 2006, Nathan was #6 and Rivera was #8
In 2005, Nathan was #15 and Rivera was #2.
In 2004, Nathan was #8 and Rivera was #6.

As you go through this list, year by year, there are two names that are on the list over and over - Nathan and Rivera. Those two, and ONLY those two, have been the model of consistency, effectiveness and health since Nathan joined the Twins in 2004.

Now, this doesn't mean that Nathan can't be traded. For the right package of players, just about nobody on the Twins should be untouchable.

But to say that Nathan is slipping, or nearly finished, is almost indefensible. His handful of failures have been more memorable because of when they happened and who they happened against, but objectively they barely dent the successes he had.

However, there is something that is even more indefensible, and that is to say that he can be easily replaced. Or even replaced at all:
- Matt Guerrier? Great this year. But his ARP last year was negative.
- Jose Mijares? His ARP was 12.8, less than half of Nathan's.
- Pat Neshek? Um, you might want to look at Francisco Liriano this year before you commit to someone coming off of Tommy John surgery?
- And the most popular - someone else? After all, Nathan wasn't anything special when we got him...

Wrong again. Nathan was already on that list of ARP leaders back when he was throwing middle relief for the Giants, ranking 24th out of 676 relievers in 2003. He was just two slots below Francisco Rodriguez that year, and that was when KRod was exploding onto the scene.

The doubters can bitch about the stat, but they're going to need bring something tangible to the table besides a couple of bad nights. The dreamers can can talk about a trade, but they're going to need to bring some realistic player packages. And both of them are going to need to bring a replacement for someone who is arguably the second best relief pitcher of this decade.

And that includes 2009.

------------------------

Late addition: For those of you saying we should trade Nathan for "the right package", I really would like to hear what you consider the right package to be in the comments section. Give me teams and names that you think are realistic and would improve the team. Thanks!

Monday, October 12, 2009

Twins Payroll 2010

To me, today is really the first day of the offseason. Yesterday, the day after the last game of the season, is traditionally a day of mourning. But it's also the day that the beat writers talk to the manager. And so today they give us their thoughts on what the Twins will be doing this offseason.

But to be candid, I mostly ignore what I read. I have for years, ever since I read in several sources that Cristian Guzman would re-sign with the Twins. A short look at the payroll situation would tell anyone that cared to look that it was never going to happen. But nobody cared to look. They cared to talk to the manager. And he liked Guzman.

That's one of the reasons I've often run a payroll breakdown for the Twins in the upcoming season around this time. The Yankees series should have driven the point home to anyone that cares to pay attention - payroll is critically important. More important than most want to admit.

How important? Well, consider how you evaluate how a team might do in the upcoming season. First, you evaluate how they did in the previous season. Then you take a look at the players they added or subtracted, or that player you think will improve or decline. So you start with a baseline (the team's previous record) and add or subtract based on their moves.

But it turns out that you've chosen the wrong baseline. If, rather than pay attention to the team's record, you paid attention to their payroll, you would have a better baseline. Statistically, it is a better indicator than a team's record as to how they will do. That's how important it is.

(And to answer the question of the sabremetrically inclined gentleman in the back who is eagerly raising his hand ... No, I haven't compared the correlation coefficient to the run differential. But I can tell you it's in the ballpark. We'll try to get to that sometime this offseason.)

Anyway, payroll counts, whether you want to believe it or not. It has, in the past, been a severe limiting factor for the Twins. That's why I wrote up a four-page analysis of the Twins payroll situation in 2010, 2011 and 2012 for the TwinsCentric Offseason GM Handbook. I and three other hard-working bloggers would sure appreciate it if you would click over and buy it to support us.

But I'm going to copy a bunch of it into today's entry, free of charge, for a simple reason - because it's ALREADY available free of charge. You can request a 61-page sample that is basically 1/3 of the whole book, absolutely free, just by clicking here. And it includes most of what is below.

Why are we doing that? I can't speak for Seth, Nick or Parker, but I'm doing it because I'm tired of the offseason stories being driven by irrelevancies, like whether or not the manager likes Guzman, or happened to whisper some kind words to Alexi Casilla. The latter isn't going to determine whether the Twins go out and sign a second baseman. It's far more relevant whether there are any decent, affordable second basemen on the market this year. And it turns out there are.

So below you'll find the payroll situation for the Twins in 2010, and you'll find a lot of financial wiggle room. At the very bottom I'll also talk briefly about something that ISN'T in the Handbook, but probably should have been.


-----------------------------


Here’s the part of your job you least look forward to: payroll.

Payroll is a limitation for all major league teams, but for the last couple of decades, the Twins have been limited to it more than most. There has been plenty of speculation that could or should change with the opening of Target Field in 2010, but the Twins haven’t announced the level of their commitment to salaries just yet.

That doesn’t mean we can’t give you a guess, especially given that we know how much has been spent the rest of this decade. The chart on the right is the club’s Opening Day salaries as computed by USA Today. We should note that it does NOT include signing bonuses, so that number for 2008 should actually be closer to $66 million due to $8.75 million in signing bonuses paid to Justin Morneau and Michael Cuddyer.

Still, you’ll notice that the Twins payroll has basically leveled off since the announcement of the new taxpayer-subsidized ballpark. And while MLB (and the rest of the world) has faced a recession during that time, we haven’t seen similar stagnation in other teams’ payrolls. Overall, major league payroll climbed 7% across the board over those two years. If the Twins payroll climbed a similar amount, it would be closer to $77 million this year, $12 million higher than it actually was.

So, given that level, we’ll add a 5% increase for 2010 and another $15 million to $20 million bump from the new stadium. Add all that up and you have 95 to $100 million to spend.

Well, not to spend, exactly. Most of that is already spoken for by previous commitments. You have some guaranteed salaries with existing players, and there are more players that you’re going to want to keep while you still control their salaries. On your left, you can see how things are set up, and the salaries of some other Twins farmhands below.

Some assumptions were made to simplify things, so let’s spell them out in case you want to make some changes.

LF/4th OF – Carlos Gomez and Delmon Young will both be eligible for their first year of arbitration, meaning they’re relative bargains, so they’re on the roster for now. I put Young in LF since he’s been there most of Sept, but feel free to move them around.

IF – Nick Punto’s salary is guaranteed, Alexi Casilla is out of options, and Brendan Harris will be eligible for arbitration and end up with a salary somewhere around $1 million. It’s possible you don’t offer him arbitration, but that also seems like a reasonable price for a utility infielder that provides offensive flexibility. Of course, with two infield bench spots, one of the three probably needs to be starting at a middle infield spot. I chose Punto. You’ll need to get rid of one of them to move him to the bench.

SP - In the rotation, Scott Baker, Nick Blackburn and Kevin Slowey seem like locks to return, and Kevin Duensing has likely earned his spot. I could’ve also put Francisco Liriano in there, but I put him in the bullpen so you had a rotation spot for a veteran if you would like. It also moved Glen Perkins off the roster completely, so he’s on the following table, with other bench names that you can use if you like.


--------------------

The story goes on to talk about the 2011 and 2012 commitments, but I want to get to a different point. One question I've received since I wrote this is how confident I am in the $15-20 million bump in payroll from the new field. The truth is that is was an off-the-cuff estimate, with almost no realy analysis behind it. So let's add that now....

A few months ago, we looked at a document from the Metropolitan Sports Commission which suggested the Twins cleared approximately $6 million in concessions and $40 million in ticket revenues in 2007 when their attendance was 2.2 million. Just straightlining that to a 3 million attendance figure adds another $16 million in revenue. If we add another 10% to that number (a reasonable expectation over the last three years) it adds another $7 million. That's a $23 million bump in revenue.

I think we can safely assume that with suites, etc., that number could go a LOT higher. But even if it doesn't, and even if payroll runs at just over 50% or overall revenue, we're talking about a $12 million bump.

Now, I should mention, I don't know enough about the other side of the ledger. I don't know how much the Twins are paying to lease the new ballpark, or how that compares to their lease of the Metrodome. Of course, I also don't know how much their receiving for the various sponsorships it's developed, like the "Target Fields" moniker or the recent deal with Treasure Island.

But a $10-$15 million bump doesn't seem unreasonable. If anything, I'd expect it to be higher.

Sunday, October 11, 2009

The Hurting

What hurts most is that this series could've been won. Instead, it was lost.

All of the lopsided differences, all the salaries, all the statistics, all the intangibles - all of it could have meant nothing. This could have been a reminder of how little we know, of the wonder that can be contained in a single game, of how inequalities can be overcome.

When I see a matchup like this last series, I think of an interview I conducted with Terry Ryan five or so years ago. I was quantifying some players and at some point, he felt the need to point out "The game is a GAME." He wasn't trying to emphasize that it was unimportant. He was pointing out that there are a million different ways to win a game. Some play it one way, and some play it a different way.

The Twins tried to play this series by leaning heavily on their pitching and stringing together hits. They did so because they just didn't have enough power to do it any other way. Joe Mauer was being pitched around, Justin Morneau was out (as was Joe Crede), and Jason Kubel might as well have been blindfolded.

They also, by the way, didn't have the speed, or at least don't know how to use it. Denard Span and Nick Punto were both decent threats, and Orlando Cabrera showed he can still guile his way around the bases a bit, but that's where it ends. One could argue that Carlos Gomez should've been in the lineup more, but anyone stating that needs to be sentenced to actually watching Gomez.

Gomez, of course, was responsible for a couple of miscues over the weekend, as were several other Twins. Any number of things could have gone a little differently - umpire calls, baserunning blunders, laughable at-bats and (maybe above all) reliever implosions. If any number of them goes some other way, everything is different.

That's the problem with playing the way the Twins were forced to play this series - there is so little margin for error. Those rallies and innings that you're trying to chain together are only as strong as the weakest link. And yet, two of the three games were there for the taking, like an umpire sitting ten feet from a fair ball. They were RIGHT THERE. Sometimes several times.

That's what hurts the most. Not that the Twins were a better team. I think by almost any objective measure, they weren't. But they still could have won this damn thing. Instead, they lost it.

Offseason
I've got a whole list of things to talk about this offseason. For those Phils fans out there who are hoping this site will once again become the Phils Geek site, I think you'll be disappointed, though The Voice of Reason™ and I will certainly be watching those games. But I just anticipate too much Twins stuff to talk about this offseason.

Don't believe me? Well, you can start with 137 pages of offseason analysis, if you like. That's how long the new TwinsCentric Offseason GM Handbook is, and you can download it now at TwinsCentric.com. I'll talk more about it tomorrow when we officially release it and dive into the offseason, but if you can't wait to turn the page (and who could possibly blame you?) click on over there and check it out.